Grain markets have a heartbeat, and it is set by the calendar. Long before a single kernel is traded, someone has decided when to plant, when to spray, when to combine, and whether to sell off the header or store until spring. Those decisions cluster into windows, and clustered decisions produce patterns in price and volatility that repeat often enough to be worth studying — and irregular enough to punish anyone who treats them as a rulebook.
What follows is a working map of those cycles: how planting and harvest windows translate into market behaviour, why the shape of the futures curve tells you more than the price alone, and where seasonal thinking genuinely helps a trader, buyer, or grower make a better decision.
The Calendar Is a Map of Uncertainty
Seasonality in grains is not primarily about supply arriving. It is about uncertainty resolving. A crop's risk profile is not flat across the year: it rises through the growing season as the number of possible outcomes expands, then collapses as the crop is made.
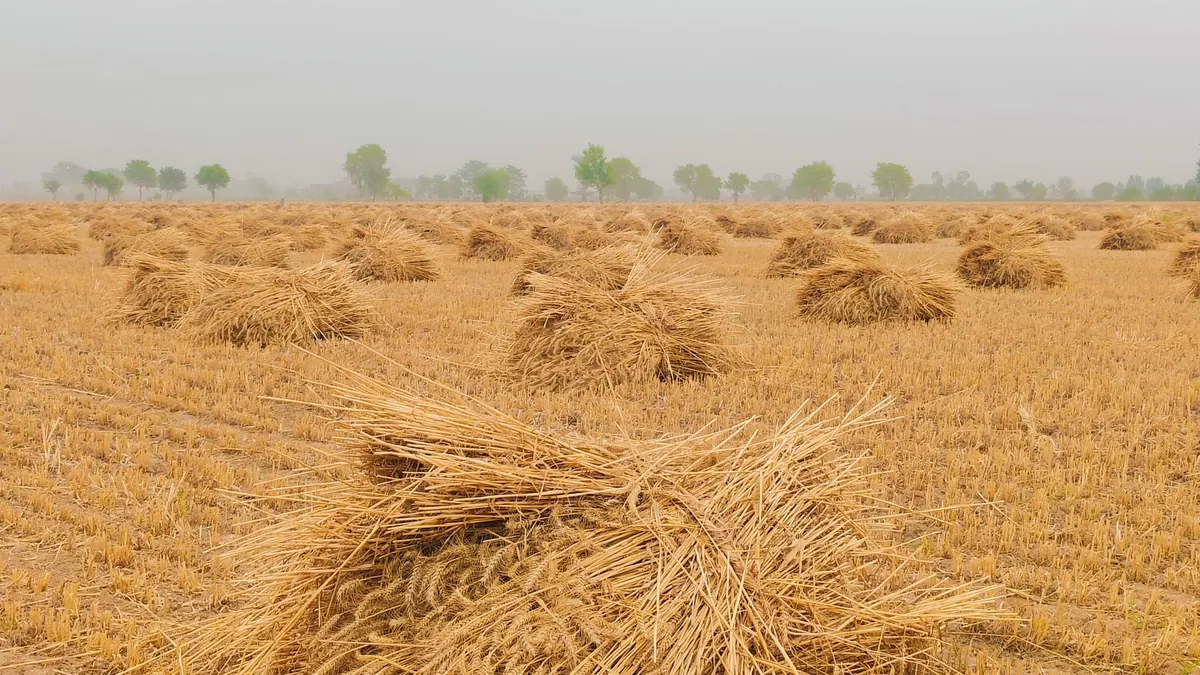
Consider the Northern Hemisphere corn belt. Planting runs roughly through April and May, and the market immediately starts asking how many acres actually went in. Pollination in July is the yield-defining window — a few weeks of heat and moisture stress can rewrite the balance sheet for the year. From September into November, combines move and the crop becomes a fact rather than a forecast.
Winter wheat in the United States and Europe is planted in autumn, goes dormant, resumes growth in spring, and is cut in early-to-mid summer. Spring wheat is planted in spring and harvested in late summer. Soybeans follow a similar spring-plant, autumn-harvest rhythm in the northern belt, with the flowering and pod-fill period in midsummer carrying the most weather risk.
Each of those windows has a different information texture. Planting season is about intentions and acreage. Summer is about weather. Harvest is about logistics and cash flow. The same commodity can behave like three different markets in one year.
Why Harvest Pressure Shows Up in Prices
When a large share of a crop comes off in a short window, physical supply concentrates. Trucks queue at elevators, rail and barge capacity tightens, and farmers who need cash for input loans or rent sell into a market where everyone else is selling too. That is harvest pressure, and it shows up most clearly not in the headline futures price but in the basis — the difference between the local cash price and the futures contract.
Basis typically weakens into harvest and strengthens afterward as the pipeline empties. If you only watch the board, you miss half the story. A flat futures market with collapsing basis is telling you something different from a flat futures market with firming basis.
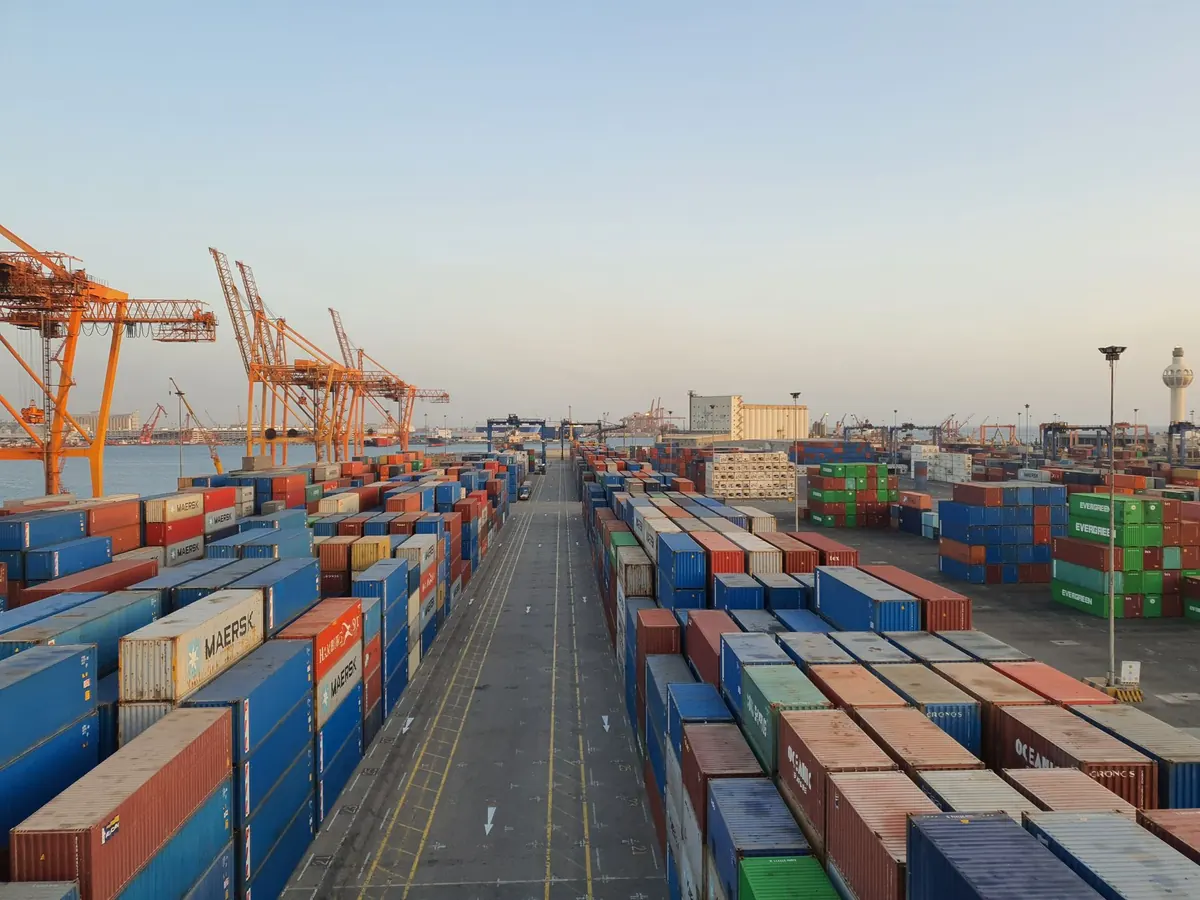
Logistics matter more than most observers expect. River levels, rail performance, port congestion and truck availability can all amplify the physical squeeze of a harvest window — or soften it if movement is smooth and storage is available.
Storage, Carry, and the Shape of the Curve
Between harvest and the following spring, someone has to pay for grain to sit in a bin. That cost — storage, insurance, interest, shrink, and the risk that quality degrades — is the anchor for the futures curve.
When the market pays more for a later delivery than an earlier one by roughly the cost of carrying the grain, the curve is in carry. Storage is economically rational, and the market is effectively inviting someone to hold inventory. When the nearby contract trades above deferred months, the curve is inverted, and the market is saying the opposite: we need the grain now, not later. Inversions are usually a sign of a genuine shortage somewhere in the physical chain.
A practical way to think about it: a carry market is a market at rest, and an inverted market is a market under stress. Seasonal patterns are most visible in carry markets, because the calendar of supply is doing the work. Inversions tend to override seasonality entirely, which is precisely why you should never short a rally simply because "it's harvest."
The Southern Hemisphere Twist
Seasonality gets messier once you look globally, and that is the point. Brazil and Argentina harvest soybeans and corn in roughly the first half of the calendar year, while the northern belt harvests in the second half. The result is that global supply events arrive in two waves rather than one.
Brazil's second corn crop, planted after the soybean harvest, adds another layer. Its success depends heavily on how early the soybeans come out and whether the rains hold. When the soybean harvest runs late, the second corn crop is planted late, and its yield risk rises. Those interactions ripple into global export competition and into the spread between old-crop and new-crop futures in the Northern Hemisphere.
For anyone trading European or Mediterranean grain markets, the practical implication is that "harvest" is never a single event. Black Sea wheat, EU wheat, North American corn and South American soy all bring supply to the world at different moments, and price reacts to the sequence, not just the total.
Reading Seasonality Without Being Fooled by It
Seasonal tendencies are tendencies, not obligations. A handful of habits keep them useful:
- Start with the physical, not the chart. Know where the crop is, what stage it is in, and what the local basis is doing. A seasonal pattern that contradicts the physical situation is describing a different year.
- Separate price seasonality from volatility seasonality. Volatility often peaks during the uncertainty windows — midsummer weather, planting delays — and fades as the crop is made. That is a different trade from directional seasonality.
- Check the curve before you commit. Carry and inversion tell you what the market is paying for time. If storage is already priced in, the "sell at harvest, buy in spring" trade may be worth less than it looks.
- Watch the calendar of reports and deadlines. Planting intentions, quarterly stocks, and production estimates cluster around the same physical windows and can produce sharp, short-lived moves.
- Respect the tail. The years that break the pattern — a drought in July, a late freeze, a sudden export restriction — are the years that matter most to your risk.
One more caution for anyone using seasonal analysis to manage real money: costs are real. Storage, insurance, financing and the opportunity cost of capital can quietly erase a spread that looked attractive on a seasonal chart. Seek professional advice where your exposure is significant.
A Practical Seasonal Checklist
If you want to put the calendar to work rather than just admire it, keep the routine simple and repeatable.
- Map the year for your commodity. Write down planting, key development stages, harvest and the main report dates for the regions that set your price.
- Track basis and spreads alongside futures. Note whether the curve is in carry or inverted, and whether the change is driven by logistics or by genuine scarcity.
- Mark the uncertainty windows. These are where volatility lives — not necessarily where price direction is.
- Set your decision rules before the window opens. Pricing targets, storage thresholds, hedge ratios. Deciding in the middle of a weather market is deciding badly.
- Review after each cycle. Note what the season did and what it did not do. Patterns are only useful when you know how often they fail.
The harvest calendar will not tell you where prices are going. It tells you when the market is likely to be uncertain, when it is likely to be heavy with supply, and when the cost of waiting is being paid by somebody. That is a modest edge, but a durable one — and in grain markets, durable beats clever.
Photo: SM PG / Pexels